Showing posts with label Education. Show all posts

Wednesday, April 16, 2008

Delanco School District Election

Yesterday, the voters of Delanco chose to accept my offer of volunteer service on the school board. Thank you! I'll do my best to represent the interests of the entire township over the next three years. If you ever have an issue regarding the schools, I'd be happy to discuss it with you. My email address is kmadams85 AT gmail.com, and I am listed in the local phone book. You can also come to the board meetings the second Wednesday of each month, 7:30 PM, at Pearson School.
The voters also rejected the proposed school budget by a margin of 200-158. I'm not surprised, given the heavy anti-tax sentiment prevalent in the state and township right now.
Is it more than that? Are the voters of Delanco really rejecting the budget as a general protest against more taxation? This budget increased property tax on the average township homeowner by $38 for the general fund, and $105 for servicing the debt approved in a bond referendum several years ago.
If you are a Delanco voter, and voted either for or against the tax levy, please let me know why. We will be negotiating potential changes to the levy with the Township Committee, so you have more opportunity for input in the coming weeks.

Tuesday, May 09, 2006

Who Knew? School Administrators Come Out Against Cuts

Corzine Watch reports that, surprisingly, school administrators don't want their budgets cut. In fact, the administrators of our institutions of higher education feel so strongly about it, they've almost taken to threatening the legislature in testimony:

The administrators also argued that the financial hardships would be far worse than the $169 million in cuts, because the state has asked schools to take on an additional $121.8 million in new costs. The heavy financial burden the state is putting on the schools could have a long-term effect. Less students would be able to afford state schooling, which could force students out of state.
The state of New Jersey spends boatloads of money on its colleges. Take Rutgers, for example. In 2006, net subsidies through the Department of State budget totaled almost $331 million; 2007 net subsidies will be just short of $275 million (click to enlarge):

What's staggering to me is the gross amount of state support to Rutgers through Grants-in-Aid -- nearly $1.6 billion. The cut in state aid, shown in this budget line, is less than $31 million, or 1.9% of the total grant. This will hardly bankrupt an institution that has been in existence since 1766.

You'll notice from the table that one other line is significantly different between 2006 and 2007: Receipts from Tuition Increase. In 2005 and 2006, Rutgers had extra income of $26 and $28 million, respectively, from higher tuition rates.

The table below, again taken from the Department of State budget, shows the cost of attendance at Rutgers increased by 3.6% in 2005, and by 5.5% in 2006. In each of those years, tuition for both in-state and out-of-state undergrads increased by 8% (click to enlarge).


This year's budget only anticipates $860,000 from higher tuitions, and this is a proper position for the governor to take. Like the state, Rutgers (and the other institutions of higher education) must learn to manage expenditures within expected revenues. The model of the past, in which revenues are managed to cover desired expenses, has got to go. Students, as the administrators have correctly recognized, can no longer afford annual 8% increases in tuition. Neither can the state.

Tags: New Jersey, Taxes, Budget, Education

Wednesday, April 19, 2006

AP on Education and NCLB

The Associated Press, in an article headlined States Omit Minorities' School Scores, engages in a nifty little piece of race-baiting. Check out the lead paragraphs from the story:

Laquanya Agnew and Victoria Duncan share a desk, a love of reading and a passion for learning. But because of a loophole in the No Child Left Behind Act, one second-grader's score in Tennessee counts more than the other's. That is because Laquanya is black, and Victoria is white.
An Associated Press computer analysis has found Laquanya is among nearly 2 million children whose scores aren't counted when it comes to meeting the law's requirement that schools track how students of different races perform on standardized tests.
This tone has carried over into the thoughts and beliefs of high school students.
"It's terrible," said Michael Oshinaya, a senior at Eleanor Roosevelt High School in New York City who was among a group of black students whose scores weren't broken out as a racial category. "We're part of America. We make up America, too. We should be counted as part of America."

If you are part of America, why would you want to be counted separately? Reporting of school test scores in the aggregate tells the system how the school is performing across the board, and allows the school teachers and administration to take action toward helping those students who aren't making the cut. As an individual, knowing the overall average and your own score tells you where you stand. Do you really need to know where you stand versus all the other kids of your own particular minority group? The whole point of NCLB was to force schools to measure their progress, not to serve as another tool for balkanization of the population.

The article does raise a valid point: there is variation from state to state on what is an appropriate group size to exclude from reporting requirements. Clearly, if a minority group in a school is statistically small, it should not be reported separately and used as a measurement of school performance. Take the extreme example of a single black student in an otherwise all-white school. Reporting the subgroup would reveal that one student's scores in a public record. The article spends so much effort on the racial angle, they don't get around to mentioning the state-to-state variation until the 18th paragraph.
In the usual mainstream media fashion, the reporters choose only to share those bits of data that support their claims, and to portray them in the most negative light possible. Take this little tidbit, for example:
Less than 2 percent of white children's scores aren't being counted as a separate category. In contrast, Hispanics and blacks have roughly 10 percent of their scores excluded. More than one-third of Asian scores and nearly half of American Indian scores aren't broken out, AP found.
Restating the same data another way, 90% of black and hispanic students have their test scores reported in separate racial categories, in addition to being reported in the aggregate numbers. In other words (please forgive me for shouting), THE VAST MAJORITY ARE BEING REPORTED.

Not only are they being reported, but it's a good news story. I paid a visit to the National Center for Education Statistics, and pulled up data on 4th-grade mathematics on a national basis. What I found will never be printed in a mainstream media piece - since 1992, black student performance has been improving over 3% per year, compared with about 1.6% per year for white students.

As can be clearly seen in the chart above, the situation is improving. And with 90% of the black student population being included in the reports, it's very difficult to argue that the increased performance is due to statistical manipulation. Note that the white, hispanic, and black lines all follow similar trends.

The collective liberal media wants us to believe that ours is a racist nation, and that we continually seek to put down minorities at the expense of the white majority. It will spin any piece of information to serve its agenda. It's clear, when you look at the data, that the chosen storyline doesn't hold water. Americans should be insulted that the liberal media thinks it can get away with such deception.

Tags: New Jersey, Taxes, Education, Media Bias

Saturday, February 18, 2006

NJ SCC Annual Report III

Every time I look at the NJ Schools Construction Corporation annual report, I get more and more perturbed. Here's another interesting fact I extracted from the data, showing what a serious problem we have.
The average school construction project for the 2004-05 school year took 17.9 months, which sounds pretty reasonable. Break them down by what organizations managed them, however, and the difference is startling. The 355 projects managed by the districts averaged 17.1 months to complete, while the 24 projects completed by SCC took an average of 29.4 months. That's more than a year longer than the locally managed jobs. The table below lays out the average project length (in months) by completion date.

Year Month Districts SCC Grand Total
2004 Jul 13.1 29.3 13.7

Aug 16.2 28.5 17.3

Sep 19.2 26.1 20.9

Oct 21.8
21.8

Nov 17.0 28.6 18.8

Dec 18.9 29.5 19.6
2005 Jan 11.5 31.4 12.0

Feb 17.9 30.1 18.5

Mar 16.3
16.3

Apr 18.9 33.1 19.3

May 17.9 42.8 18.5

Jun 19.3 31.7 21.5
Grand Total
17.1 29.4 17.9

So, not only is NJ SCC incapable of estimating or controlling costs, but it apparently is also incapable of completing its jobs in a reasonable amount of time.

The SCC must be closed. The people of New Jersey have poured far too much money into this sink hole.

Tags: Jersey, Taxes, Education, NJSCC

NJ SCC Annual Report II

In a comment to my first post on this subject, Joe says:

Just think most of the work done on the schools is by non union contractors. I'll bet if they were done by union contractors they would be done faster and cheaper.
Either Joe has an extremely dry wit, or he is simply uninformed. You see, New Jersey practically requires the use of union labor on school construction projects funded by the SCC. This is done through a mandate for Project Labor Agreements (PLAs). According to he SCC web site:
On January 18, 2002 Governor McGreevey signed Executive Order 1, which provides that:

On a project-by-project basis, a state department, authority, or instrumentality shall include a PLA in a public works project where it has been determined that the agreement advances the state's interests of cost efficiency, quality, safety, timeliness, skilled labor force, labor stability, and the state's policy to advance minority and women-owned businesses.

On July 30, 2002 Governor McGreevey signed legislation that authorizes the use of Project Labor Agreements on major public works projects.
These PLAs do nothing but add costs to a project. For example, they require each contractor and sub-contractor to have a registered apprentice program, driving up the contractor's labor cost by making him hire untrained people. PLAs also specify whom the contractor must hire:
A PLA must require the contractor to provide "whatever resources necessary" to prepare for the apprenticeship of the number of women and minorities as set forth in the publicly available plan.
On top of the PLA requirement, New Jersey also requires that contractors pay the "prevailing wage" to their employees on public projects. The prevailing wage is typically set at whatever rate the unions demand (emphasis added):
The Act requires the payment of minimum rates of pay to laborers, craftsmen and apprentices employed on public works projects. Covered workers must receive the appropriate craft prevailing wage rate as determined by the Commissioner of Labor and Workforce Development. Prevailing wage rates are wage rates based on the collective bargaining agreements established for a particular craft or trade
If they fail to do so, then they are debarred from bidding on any public project in the state. The current list of debarred firms runs 20 pages.

Just how expensive is this? Let's look at a single job - new construction painting. Imagine a job where you need four painters for two and a half (8-hr) days to knock out the work, or a total of 80 hours of actual work. According to the Burlington County prevailing wage rates (pages 40-41), a Journeyman painter must be paid $45.30 an hour (including $13.25 in benefits). The contractor must also pay social security taxes of 6.2% on the labor rate, driving his total cost to $47.29 per hour, or $3,782 for the job.
But that's not all. The state requires all contractors to have apprentice programs as noted above, and in the prevailing wage determination (page 68) sets the ratio of apprentices required. For painters, it's 1:4, so on this job we have to add an apprentice. His rate is also set in the same document (page 65), and for a mid-level apprentice (1.5 years) its 70% of the journeyman's wage, or $31.71, plus $6.27 in benefits, plus $1.97 for social security - $39.95 per hour, or $799 for the 20-hour duration of the job. The apprenticeship requirement is, in effect, a 21% increase in project cost.

What would this project cost if the prevailing wage and PLA requirements were not in place? The lowest possible cost would be the minimum wage, currently $6.15 per hour, plus the 6.2% social security tax. That would set the labor cost at $522. Now, on a new construction project, I don't want a crappy job, so I would want to hire someone with some skill and experience. If I was willing to pay three times the minimum wage for this work, it would cost $1,567 to get the job done. I don't know if those are reasonable rates, so I checked craigslist in the Philly area and found an independent "Professional painter/paperhanger looking to stay busy." He claims thirty years experience, has his own equipment, is fully insured and is willing to work as a subcontractor. His rate: $25/hr. If I hire him as a sub (letting him pay his own social security out of his quoted rate) to do my hypothetical job, this painter would cost me about $2,000.

Non-union subcontractor at $2,000, or meet the PLA and prevailing wage requirements for $4,581. Which is more cost effective, Joe?

Tags: Jersey, Taxes, Education, NJSCC

Friday, February 17, 2006

NJ Schools Construction Corporation Annual Report

[Welcome, Carnival riders! If you find this post enlightening, there's more here and here].

The New Jersey Schools Construction Corporation has published its annual report to the governor and legislature. Paul Nelson of NJ Fiscal Folly provides a nice, simple summary of the document: We're All Doomed, Doomed I Tell You!

Painfully, I've read the whole thing. It's not pretty, but the $12.8 billion cost widely quoted in the press is nothing more than a fantasy. The details of this fantasy start on page 77 of the report, but here's the game they are playing:
Step 1: Take the January 2005 construction cost estimates (CCEs) from the project management firms (PMFs) and add 7.5% escalation for the age of the estimates
Step 2: Add a further 15% "contingency"
Step 3: Add 2% to the design fees to account for restarting the work that was stopped
Step 4: Add 1-1.5% for permit fees, plus 0.25% for "other miscellaneous fees"
Step 5: Add 0.5% for temporary space.
Step 6: Add 2% for Schools Construction Corporation overhead.
Here's a real killer: "PMFs are compensated based on a percentage of the CCE of projects that they are managing." In other words, the PMFs are incentivized to generate construction cost estimates that are as high as possible.
So, in summary, an artificially inflated construction cost estimate is then further inflated by nearly 30%.
After establishing a nice, high baseline, SCC then moves to scare us into buying in now rather than later. They take the baseline, and further inflate it for two ridiculous cases -- waiting five or ten years to start the same projects. They apply an annual 7.5% inflator to the construction costs, and 15% inflation to the land acquisition costs. From page 81:

The proposed 15% adjustment is largely due to the anticipated increased value of real estate (primarily residential) and also takes into account anticipated increased cost for services (outside legal counsel, appraisal, review appraisal, title, relocation and property maintenance). The adjustment for anticipated market conditions is based on the SCC’s experience in all Abbott District market areas except Phillipsburg, Vineland and Millville over the past 5 years. All market segments, as seen in the Market Studies (Residential, Industrial and Commercial), have advanced significantly (largely 15 - 20%) each year since 2001. These studies are based on unaltered sales data from the Multiple Listing Service.
Apparently, they haven't been reading Grim over at the Northern New Jersey Real Estate Bubble. There's always the possibility that Grim is wrong, but no market can go up forever. Take a look at the Camden area, for example, since Camden is an Abbott District. Recently, the market's been climbing at a pretty good clip, based on the Office of Federal Housing Enterprise Oversight's quarterly home price index (last updated for 3rd quarter 2005).

Note: In each of the following charts, the blue line represents the home price index (left scale), while the red line indicates rate of change (right scale). I know the clarity isn't very good, but I will try to clean it up later.


There was a similar growth trend in the Camden market back in the 80s, as you can see here:


But what happened in between? Nothing! The market was essentially flat for about six years, as you can see in the next chart.

My point here is simple: previous year market trends cannot be used to reliably predict future movement! The Schools Construction Corporation wants us to believe that it can accurately estimate the cost of a construction project five-to-ten years from now, when it cannot even get a handle on current year spending. I think we ought to give them five-to-ten years, but in a Federal prison rather than in our wallets.

Governor Corzine, do not spend another dime of my money on this fiasco. Cut our losses, ignore the arrogant Supreme Court, and stop feeding cash into the gaping maw of the Abbott Districts.

Tags: Jersey, Taxes, Education, NJSCC

Wednesday, February 15, 2006

54th midway of the Carnival of Education

The Carnival of Education is up over at The EdWahoo. They were kind enough to pick up my post on recent hish school proficiency scores in New Jersey. Lots and lots of links to peruse, covering the gamut of educational issues.

Tuesday, February 07, 2006

School Performance

Digging around in the 2004-05 New Jersey School Report Card database, I ran across some interesing data that I thought I would share. First, the bad news. The Access database is as poorly organized as always, so extracting information from the data is going to be a long, hard slog.

But, there's also good news, and in a surprising location. I stumbled into the vocational school districts while looking to confirm the trends from last year's post on this subject. In the vocational districts, about 3600 students take the High School Proficiency Assessment each year. Their performance has been increasing steadily since the 2002-03 school year, as shown in the table below:

Subject YEAR Fail Proficient AP
Lang 0203 25% 61% 13%
Lang 0304 23% 63% 13%
Lang 0405 19% 62% 18%
Math 0203 45% 37% 17%
Math 0304 38% 39% 22%
Math 0405 29% 46% 25%

What's causing this improved performance? Hard to say, but ... could this be measurable impact from the No Child Left Behind Act?

Tags: New Jersey, Education

Sunday, February 05, 2006

Enlighten-NewJersey: Evaluating New Jersey’s Public Schools

Enlighten-NewJersey points out the Star-Ledger's very useful tools for accessing both school performance and local tax data. I'm working on a little something based on that data, and hope to have something to show for it shortly.

Tags: New Jersey, Education, Taxes

Tuesday, November 29, 2005

Terrorism of a Different Kind

America won a battle in the war on terrorism last week, but not in the "traditional" Islamists vs. the world struggle. This particular form of terrorism afflicts all of us, yet we've hardly been able to do anything about it. Until last week, in Texas.

What am I talking about? Judicial terrorism. The kind imposed on us by liberal courts over the years. The kind that usurps the power of the state legislatures, local school boards, and the people to decide how best to educate our children.

Today's editorial from the Wall Street Journal sums up the Texas victory:

The Texas Supreme Court did the expected last week and struck down the statewide property tax for funding public schools. But what was surprising and welcome was the Court's unanimous ruling that the Texas school system, which spends nearly $10,000 per student, satisfies the funding "adequacy" requirements of the state constitution. Most remarkable of all was the court's declaration that "more money does not guarantee better schools or more educated students."
The Texas Classroom Teachers Association (TCTA) also comments on the decision, with predictable spin (emphasis mine):
The Texas Supreme Court issued its highly anticipated ruling on Nov. 22, 2005, in the latest, and, for now, definitive, round of school finance litigation. The litigation involved the state of Texas defending itself against a challenge by two groups of school districts asserting that the current system of school finance was unconstitutional because it was inadequate, inefficient and effectively constituted a statewide property tax which violates the Texas Constitution. The trial court agreed with the school districts on all major counts, except one relating to facilities funding. The state and districts involved agreed to skip the appellate court and bring an expedited appeal directly to the Supreme Court.
In summary, the Texas Supreme Court agreed with the trial court that the school finance system essentially establishes an unconstitutional statewide property tax. However, the Supreme Court reversed the ruling of the trial court with regard to adequacy and efficiency. Though TCTA certainly would have preferred that the Supreme Court rule that the schools were inadequately and inefficiently funded, the state’s win on these points appears to be a narrow one. As you will note from the excerpts from the actual decision below, the state appears to have “squeaked by” for now.
The complete decision by the court is here. TCTA exerpted the decision in their summary. Here are some encouraging bits:
  • Deficiencies and disparities in public education that fall short of a constitutional violation find remedy not through the judicial process, but through the political processes of legislation and elections.
  • [T]he judiciary’s duty is to decide the legal issues properly before it without dictating policy matters.
  • The public education system need not operate perfectly; it is adequate if districts are reasonably able to provide their students the access and opportunity the district court described.
  • The Constitution does not require a particular solution. We leave such matters to the discretion of the Legislature.
Contrast this decision with the reality here in New Jersey, imposed on the taxpayers by the ten (!) decisions in Abbott v. Burke from 1997-2003. They include the requirement for the Legislature "to assure by the commencement of the 1997-1998 school year, that per-pupil expenditures in the poor urban districts are equivalent to the average per-pupil expenditure in the wealthy suburban districts."
They also require the commissioner of education to implement full day kindergarten and half-day preschool programs for 3- and 4-year-olds, school-to-work programs and alternative schools. Finally, and most expensively, they require funding for whatever supplemental programs the districts want, funding for "life-cycle and infrastructure deficiencies," and the assumption of management responsibility for school construction.

The courts can have a large impact on state policy toward any number of things, but have no business setting those policies. New Jersey courts have consistently gotten it wrong on education. Texas has gotten it right, this time.

Sunday, November 20, 2005

Rhodes Scholars

I am usually proud of the accomplishments of my alma mater and her graduates. Today is no exception. Three US Naval Academy midshipmen and one grad have been chosen for 2006 Rhodes Scholarships, more than any other school in the country. They are:

Ensign William R. Kelly, New York (USNA and Harvard)
Nicholas M. Schmitz, Bethesda, Maryland
Paul J. Angelo, Columbia Station, Ohio
Jacquelyn R. Hanna, Lisbon, North Dakota

Full article at here [cnn.com]

For those who wish to keep score:

U.S. Naval Academy

4

Yale University

3

University of Chicago

3

Duke University

3

Stanford University

2

University of Washington

1

Nebraska Wesleyan University

1

Rice University

1

Gettysburg College

1

Amherst College

1

Florida State University

1

University of Pittsburgh

1

Wake Forest University

1

Wheaton College (Mass)

1

Dartmouth College

1

Wabash College

1

Brown University

1

University of Pennsylvania

1

University of the South

1

Princeton University

1

University of Richmond

1

University of Denver

1


This brings me to an interesting thought about anti-military bias. I find it remarkable that four students from a single institution could be selected for such a prestigious honor, yet the Associated Press doesn't mention it in the article. Am I being overly sensitive?

(Thanks for the open trackback posts!: The Blue State Conservatives, Is It Just Me?, Soldier's Angel Holly Aho, The Political Teen, and Don Surber.

Monday, August 08, 2005

New Jersey Democrats, Teacher's Unions Conspire to Drive Up Cost of School Supplies

This handy press release announces a press conference intended to pressure Wal-Mart.

The "Send Wal-Mart Back to School" Campaign is part of nation- wide effort being led by the two largest teacher's groups in America, the American Federation of Teachers (AFT) and the National Education Association (NEA), and WakeUpWalMart.com. The ATF and NEA have partnered with WakeUpWalMart.com in what is latest phase in the growing national campaign to change Wal-Mart that began in April of this year.
Apparently, because Wal-Mart is not unionized, the teacher's unions feel compelled to join the UFCW in criticizing the company at every turn. Also piling on will be some of our favorite New Jersey political figures:
Teachers and other speakers at the press conference, which include United States Senator Jon Corzine, Assemblymen Jack Conners and Herb Conaway, and many local political leaders, will highlight how Wal-Mart has repeatedly failed America and our community.
Sure, Wal-Mart has failed America. Failed all of us by bringing us decent quality goods, when we need them, at reasonable prices. While employing 1.3 million people. Profitably.
Their excuse for all the big-company bashing is, of course, "the children."
Speakers will, in particular, call on Lee Scott, CEO of Wal-Mart, to adopt a "Zero Tolerance" policy and promise the American people that Wal-Mart will forever end its exploitation of children in the United States and globally, and will no longer break child labor laws in America.
Because, of course, zero-tolerance policies work so well.
Local teachers, community leaders, and students, will also discuss the growing negative effect Wal-Mart has on all of America's families and children, as well as our public schools, because the company increasingly shifts its costs on to American taxpayers.
This press conference is taking place on school property, specifically the Samuel L. Ridgeway Middle School in Edgewater Park, New Jersey. Seems to me, that by using a public facility for their press conference, UFCW, the teacher's unions, and the politicians are shifting the cost of their campaign against Wal-Mart onto the taxpayers of Edgewater Park. I wonder how many hours of overtime this will require by the police department, the school maintenance folks, etc.

Our family will be purchasing school supplies at Wal-Mart this year.

Wednesday, July 27, 2005

Federal Funding For Education

Enlighten New Jersey points out that Federal Funding For Education Soars, Results DonÂ’t, which leads me to follow up on my last post about educational performance. There, I showed that there was no relationship between average salaries, number of staff per student, and performance, yet there is significantly different performance between socio-economic groups.
How do we solve this problem? Enlighten offers an interesting, almost Swiftian solution:

Those schools producing results should maintain current levels of funding; those that don'’t should lose funding until results are achieved. Schools still not producing should continue to lose funding until they hit the same average per pupil spending rate as non-Abbott schools.
Could it work? Let's take a look at the correlation between federal funding and performance to see if there are any answers. We already know that there's a significant difference in performance between district factor groups, so to isolate that we'll look only in the worst group, DFG A.

Over the last three years, there are significant differences in federal funding between counties in DFG A, both in mean and variance. The analysis of variance shows that in Hudson county, the average federal funding per student was $398, while in Cape May it was $660, and that Cape May and Monmouth Counties had significantly more variation than the rest. (Note on the graphs: values outside the red lines are statistically significant differences from the overall mean, with the significance limits driven by sample size.)


The variation from year to year does not appear to be significant, so the differences are likely occuring between districts. The graph to the left shows federal funding per student for each of the districts in DFG A. Six districts are significantly different from the mean of $512. Asbury Park, Camden City, Wildwood, and Woodbine each receive around $800 per student, while East Newark receives less than $200 and Harrison falls at about $340.


Are these federal dollars making a difference? A plot of test scores versus federal dollars per student would be useful here. I've chosen the percentage of students rated as partial proficient (by district), which shows an interesting trend. As federal dollars increase, partial proficiency (i.e., failure) also increases. If we limit the sample to just those districts that are different from the overall federal funding mean, the trend line is essentially unchanged. Based on this data, I would conclude that there is some negative correlation between federal funds spent per student and student performance -- as federal spending increases, performance decreases.

Performance on standardized tests also appears to be related to both state and local spending per student, but not as strongly as with federal spending. State spending shows a similar increase in failure (partial proficiency) to the federal results, while local spending levels appear to drive the result in the other direction. I wouldn't call it conclusive proof, but this suggests to me that the best way to improve the performance of our schools is to get control of funding back to the local level, and get the state and federal governments out of the process.

Sunday, July 24, 2005

Educational Performance

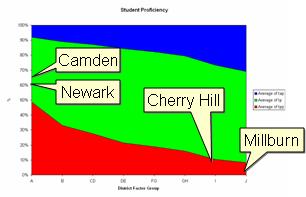
A while back, Enlighten-New Jersey posted an interesting item comparing high school proficiency assessment (HSPA) data from four school districts. Their comparison of Newark and Camden ($15k per student, more than 1/2 not proficient in math or language) to Millburn and Cherry Hill ($11k per student, less than 10% not proficient) made me curious: are there any strong, statistically valid relationships between financial and performance numbers?

Conveniently, the State of New Jersey publishes an annual set of school report cards. Looking up a single school is easy, and the raw data is also available. This database is not for the faint of heart, however. 35 MB of MS Access await; if you choose to download, grab the zipped version. An Excel version is also available.

If you've ever worked with or designed large databases, you'd be appalled at what I found. There are no key fields, and no indices, in any of the 25 tables provided. The same values (County Code, District Code, and School Code) are repeated over and over to identify each row of data. Numerical values are stored as text in some tables. (In the Excel version, ALL values are stored as text). Field names are cryptic: the assessment table includes names like tap, map, fap, wap, bap, aap, nap, hap, oap, gap, sap, mgap, lap, and eap. Each of these contains advanced proficient percentages for a different subgroup of students. It is nearly impossible to use the power of database queries to analyze this data.

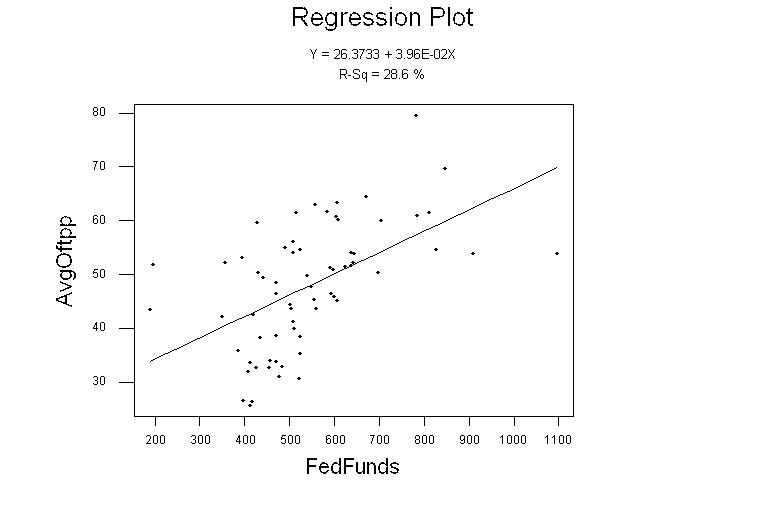
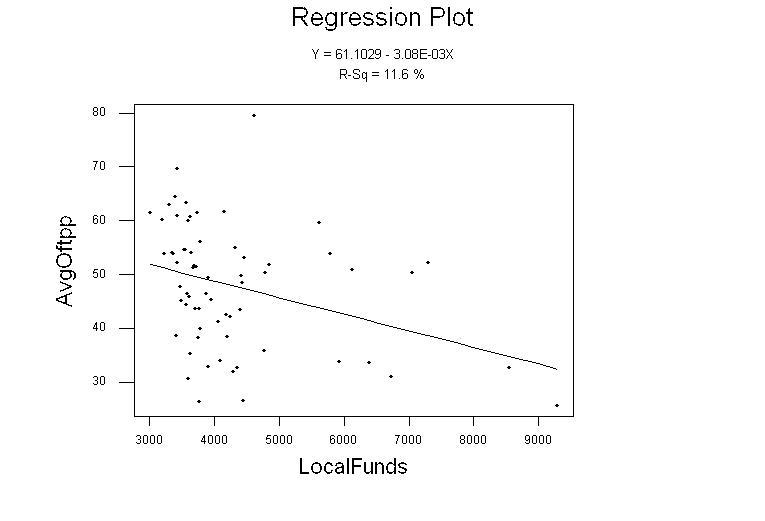
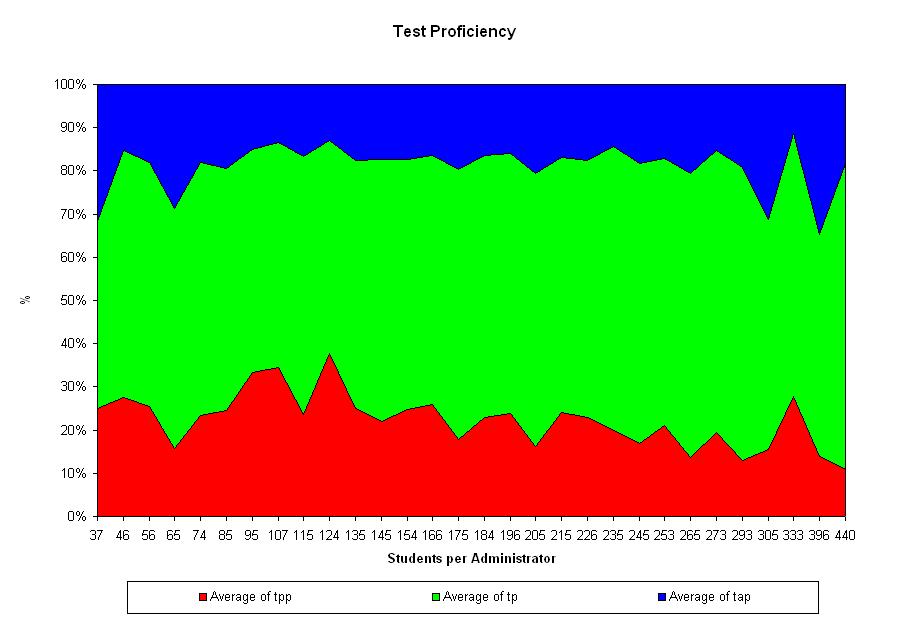
Fortunately, I've finally found some time to look at the data and pull out a few interesting comparative charts. I decided to start out looking at the elementary school Assessments of Skills and Knowledge (ASK3 & ASK4), Grade Eight Proficiency Assessment (GEPA), and High School Proficiency Assessment (HSPA). Enlighten had shown a wide gap in performance between pairs of Abbott and non-Abbott districts with strong negative correlations between spending and performance, and I wanted to understand whether or not these were just extreme examples of indicative of a trend. Instead of per-pupil spending, however, I decided to look first at the staff information that was available - administrator and teacher salaries and ratios per student. Each of the following graphs shows the relationships between student performance and one of the staff factors. Red indicates the percentage “partially proficient,” i.e., not proficient in the tested material.

Students per administrator

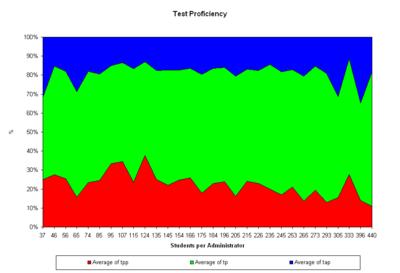
It’s pretty clear from this set of data that there is no difference in student test performance attributable to the number of administrators in the district. Any argument that a district “needs” more non-teaching positions to bolster academic performance should be opposed on the basis of this data.

Average Administrator Salary

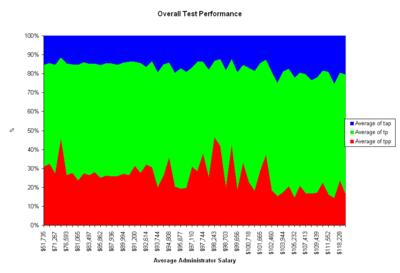
Like the number of students per administrator, there is no clear relationship between administrator salaries and student proficiency.
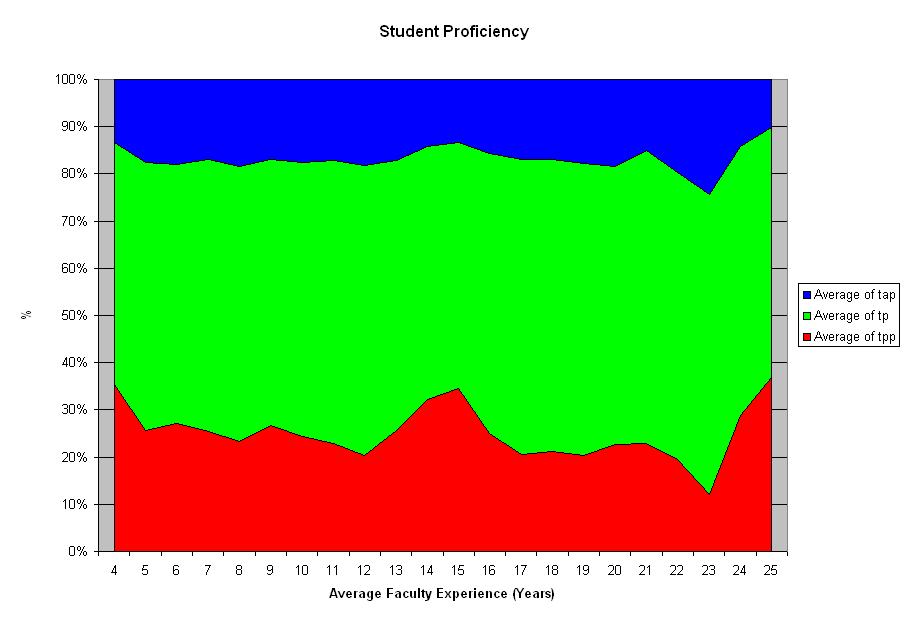
Teacher Experience

Again, no very strong trends present themselves here. There is an interesting spike in failing grades at the top end of the scale, but statistical testing shows it is no different than the overall mean.

Teacher Salary

If you expected teacher salaries to have a strong relationship to overall student performance, you’d be wrong.

Student-Teacher Ratio


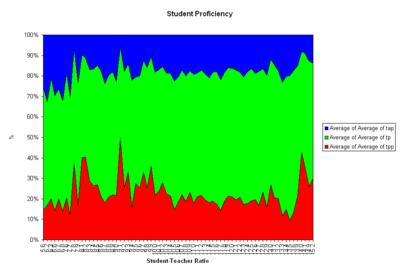
One of the standard claims made by the teachers unions, and many administrators, is that having fewer students per classroom improves performance. In the tables provided by the state, it’s a bit difficult to get at that number and relate it to performance. The Salary table I’ve been using here includes the ratio of students per administrator (field name dstad), and the number of faculty per administrator (field name dfacad), each at the district level. I’ve combined the two, dividing dstad by dfacad to arrive at number of students per faculty member. As you can see from the graph, there is no strong relationship between student-teacher ratio and performance. The spike at the high end looks interesting, but again is not statistically significant.


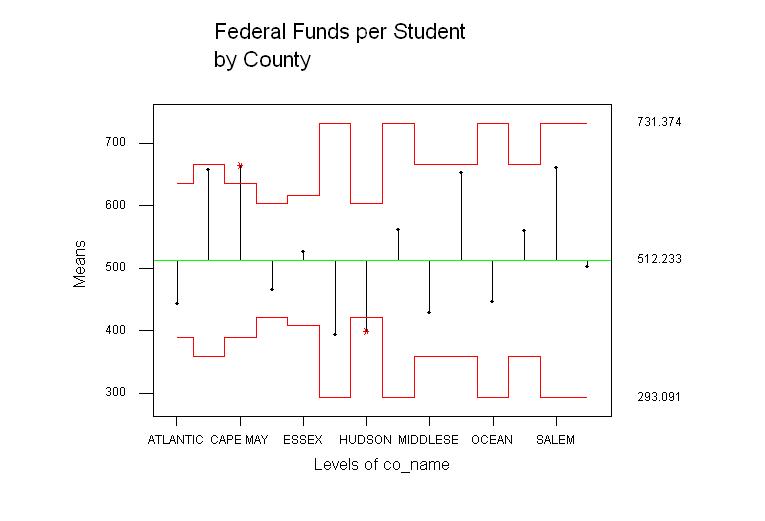
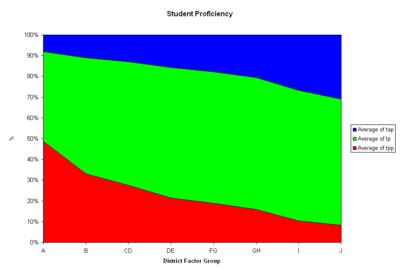
So what does correlate with performance? At a school board meeting a while back, our district superintendent told the board that research had shown the only factor that could be repeatably shown to relate to student performance was the economic means of the community in which they lived. 
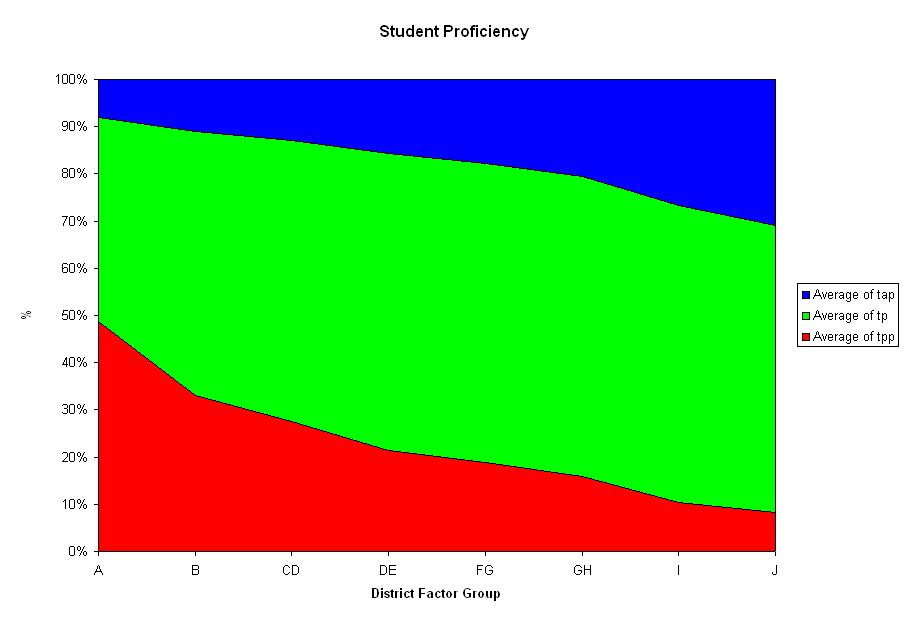
New Jersey classifies school districts by District Factor Group (DFG), which indicates “the socioeconomic status of citizens in each district.” Based on US Census data, the factors include adult education levels, occupations, population density, income, unemployment, and the percent of residents below the poverty level. DFG is strongly correlated with student performance.

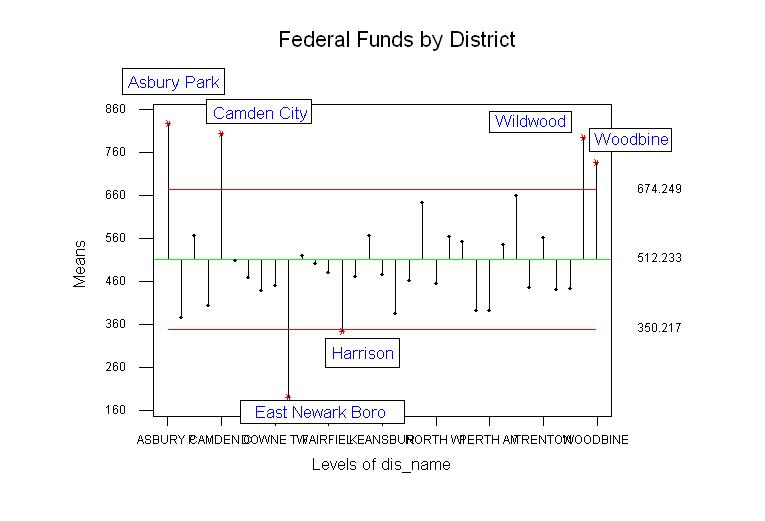
The districts chosen by Enlighten to illustrate the point about spending versus performance are typical for their DFGs. I’ve marked their 03-04 average for partial proficient students on the chart.

How can we solve the differences in performance between schools? I don’t have an answer. But the data tells me that adding staff, finding more experienced teachers, reducing class size, and paying teachers more will not solve the problem. The cause appears to lie in the socio-economic factors in the districts where we live. We have to stop throwing money at the problem.

Wednesday, February 16, 2005

State versus Local Taxation

First, the local part. In Delanco, our school board is trying to pass a bond referendum to pay for an expansion of our elementary and middle schools. The special election on March 8th attempts to deal with the projected growth of the district from new construction. According to the board (as reported by Todd McHale of the Burlington County Times in Delanco board hits road to sway voters, February 14th), the $10 million referendum would cost the average homeowner approximately $77 the first year, rising to about $121 in 2007. This sounds like a reasonable investment in the education of our children, given that it translates to a monthly increase of about $6 per month for those of us who pay taxes through mortgage escrow accounts.

Some groups of township residents don’t wish to pay for this necessary expansion. This is the fourth time the board has asked the township taxpayers to fund the project. Narrowly defeated on the first attempt, the margin of defeat has grown each time. Many in town believe that the repeated defeats are due to the residents of Newton'’s Landing, a recently constructed development. McHale says,

[A]t Newton's Landing, a 250-unit age-restricted development, the road show wasn't a hit. Three dozen residents grilled [district superintendent Joe] Miller and [board member Phil] Jenkins for more than two hours about the project and complained that they are already paying too much in taxes.

Now, for the state bit. Joe Donohue of the Star-Ledger reports (Tax rebate may face trim, says governor, February 16) that acting Governor Codey plans to "save" $800 million by rolling back property tax rebates.

In an hourlong interview with the editorial board of The Star-Ledger, Codey said middle-class homeowners who were eligible last year for a maximum $800 rebate may end up with checks of $300 or less. He said seniors and disabled people would see their maximum rebate drop from $1,200 to $800. The acting governor will propose his budget March 1.

Why does the acting Governor have to go after this $800 million? To cover part of a $4 BILLION budget shortfall created by additional proposed spending on other “priorities,” like $380 million for stem cell research.

For those who are angry with the Delanco (or any other town for that matter) school board, consider the impact on your tax situation driven by the board compared to that created by the state. Delanco asks for your help, while the state will simply take the money away from you. Redirect your anger toward Trenton, as that is where the problem lies. Our township children must be educated in appropriate facilities, but there is no driving need for the state to do many of the things it proposes. Call your Assemblymen, fax your Senator, write the Governor to tell them to keep their hands out of your pockets; and please, come out to vote YES on March 8th so that our kids have the school facilities they need.

Wednesday, February 02, 2005

New Jersey Governor's Race -- Education

Maintaining or improving education for our children is a pretty important issue at the local level. Since all politics is local, I would expect that the Republican candidates for governor would have something to say about it. Here’s what I found:

Paul DiGaetano says that he “has a record of bringing home record amounts of dollars for the classrooms in his district” and that “local schools need to get a fairer share of the tax dollars being sent to Trenton.” He then says he “will continue in his tradition as a budget hawk, insisting that spending on education focus on the classroom” while he will “remain a leading advocate for our best teachers, making sure they have the resources to do their job effectively.”


This policy statement doesn’t make a whole lot of sense for a gubernatorial candidate, but would sound great for an assemblyman.

Doug Forrester doesn’t have a specific education policy statement on his web site, but in his candidacy announcement he cites “an excellent education for every child” as part of the American Dream. I’ve asked for his thoughts on how to achieve this vision, and will publish the response when I receive it.

Steve Lonegan says “quality is not achieved simply by throwing vast sums of money into a system that is hardly a model of efficiency.” He follows up with this: “The key is to return teachers and teaching to the ranks of a profession – rather than the industrial-style union mentality that prevails today.” He offers a 10-point plan to improve our state’s educational system:

1. Vouchers for students in failing districts

2. Equal per-pupil aid for every district

3. Return control to local decision-makers

4. Prohibit school employees from sitting on school boards

5. Move board elections to November to increase voter participation

6. Cap budget increases

7. End construction project labor agreements

8. Count student population monthly instead of annually

9. Enforce voter rejection of capital projects

10. Expand outsourcing of support services

John Murphy doesn’t have anything to say about education on his site. I even did a Google Search and came up empty. I contacted him via the web form on the site, and will publish his response when I receive it.

Like Murphy, Bob Schroeder doesn’t spell out any specifics on education on his site. I only found two references to the term:

1. In his web contact form, a drop-box has a list of topics to select from, and includes education. (I used the form to ask what he thinks. When he responds, I will post it here.)

2. In an article about a fundraiser speech (May 5, 2004): “After applause subsided, Schroeder proposed changes in property tax, health care, auto insurance, education, transportation and tolls.”

It’d be nice to have the transcript of that speech – we might learn something from it.

Bret Schundler has not stated a position on education, but does claim a record of improving it as mayor of Jersey City. His site reprints a NY Times article from 1994 that states his top priority was “turning Jersey City's schools, which the state took over five years ago [i.e., in 1989], into a national model with a system of education vouchers.” His biography page claims “effective innovations in education” in his 2nd and 3rd terms as mayor.

Like the other candidates who have not yet published any specifics on education, I’ve asked via email and will post the response.


I expect the governor to communicate a vision for education, set priorities that lead to achieving his vision, and hold people accountable for delivering results. Spending more money that we don’t have will not solve any problems. It looks like Steve Lonegan has given a lot of thought to education reform. Doug Forrester has a good one-liner vision so far, and Bob Schroeder had a plan about 9 months ago but doesn't currently publish it on the web. We'll have to wait and see what, if anything, Bret Schundler and John Murphy have to say.

This topic is intimately linked with tax reform, since most of the cost of local government is sunk into the education of our children. My next installment will cover the candidates’ positions on taxes. That’s going to be a LONG post, so give me a few days.