Federal Funding For Education
Enlighten New Jersey points out that Federal Funding For Education Soars, Results DonÂ’t, which leads me to follow up on my last post about educational performance. There, I showed that there was no relationship between average salaries, number of staff per student, and performance, yet there is significantly different performance between socio-economic groups.
How do we solve this problem? Enlighten offers an interesting, almost Swiftian solution:
Those schools producing results should maintain current levels of funding; those that don'’t should lose funding until results are achieved. Schools still not producing should continue to lose funding until they hit the same average per pupil spending rate as non-Abbott schools.Could it work? Let's take a look at the correlation between federal funding and performance to see if there are any answers. We already know that there's a significant difference in performance between district factor groups, so to isolate that we'll look only in the worst group, DFG A.
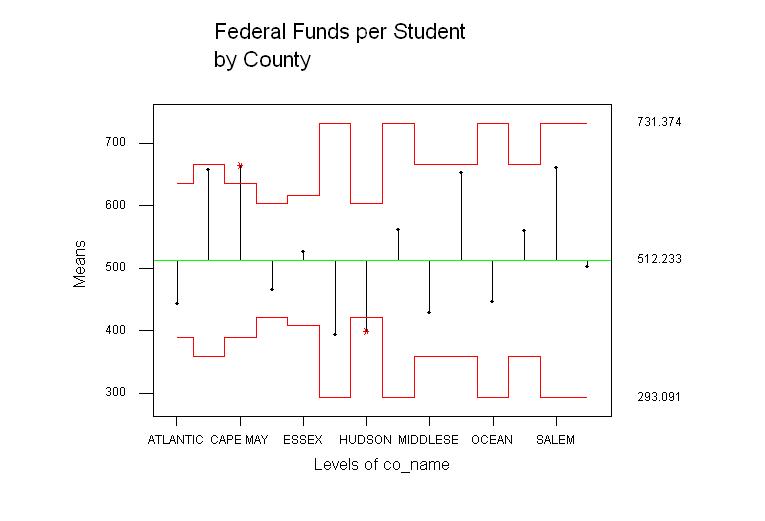
Over the last three years, there are significant differences in federal funding between counties in DFG A, both in mean and variance. The analysis of variance shows that in Hudson county, the average federal funding per student was $398, while in Cape May it was $660, and that Cape May and Monmouth Counties had significantly more variation than the rest. (Note on the graphs: values outside the red lines are statistically significant differences from the overall mean, with the significance limits driven by sample size.)
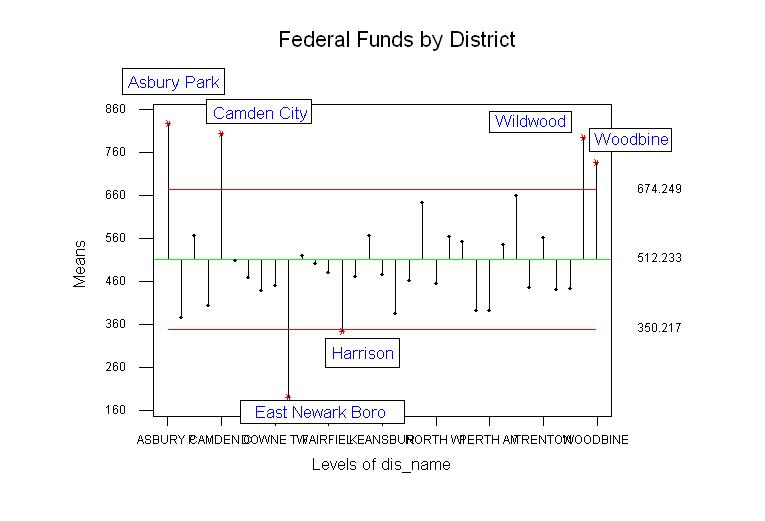
The variation from year to year does not appear to be significant, so the differences are likely occuring between districts. The graph to the left shows federal funding per student for each of the districts in DFG A. Six districts are significantly different from the mean of $512. Asbury Park, Camden City, Wildwood, and Woodbine each receive around $800 per student, while East Newark receives less than $200 and Harrison falls at about $340.
Are these federal dollars making a difference? A plot of test scores versus federal dollars per student would be useful here. I've chosen the percentage of students rated as partial proficient
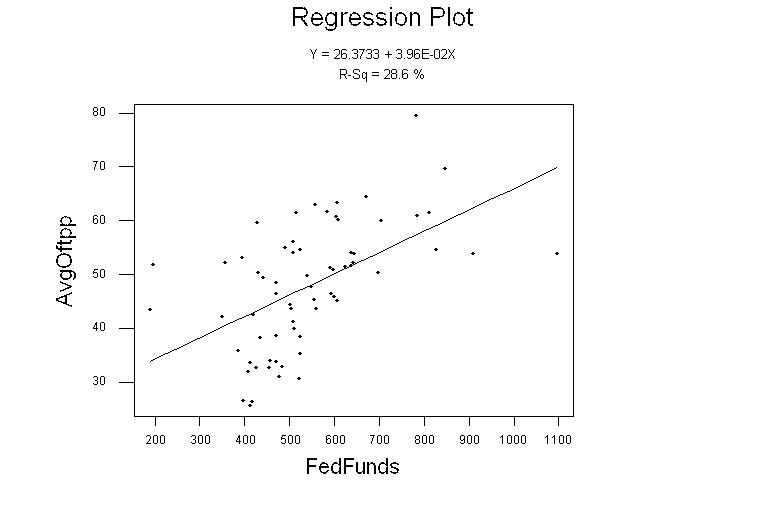 (by district), which shows an interesting trend. As federal dollars increase, partial proficiency (i.e., failure) also increases. If we limit the sample to just those districts that are different from the overall federal funding mean, the trend line is essentially unchanged. Based on this data, I would conclude that there is some negative correlation between federal funds spent per student and student performance -- as federal spending increases, performance decreases.
Performance on standardized tests also appears to be related to both state and local spending per
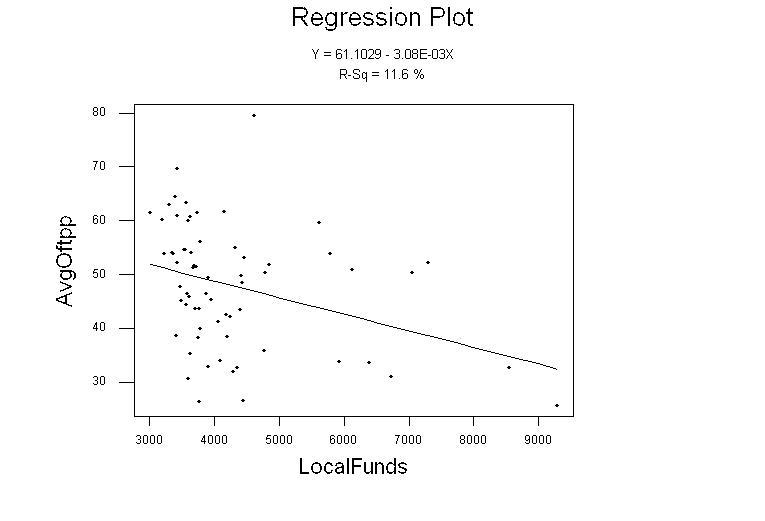 student, but not as strongly as with federal spending. State spending shows a similar increase in failure (partial proficiency) to the federal results, while local spending levels appear to drive the result in the other direction. I wouldn't call it conclusive proof, but this suggests to me that the best way to improve the performance of our schools is to get control of funding back to the local level, and get the state and federal governments out of the process.


|